Mapping Tools
Stakeout
Stakeout provides advanced browsing and analytical tools. Stakeout allows a user to define one or more locations of interest, with associated dates and times (optional), to virtually find the common link for multiple locations and view any visits that were made to the locations by vehicles that are equipped with Vigilant CarDetector (site-owned, shared, or commercial).
Search Criteria
Two required fields are needed to do a Stakeout query, the Address or Geo-Zoned area and desired Time Period. There is also the option to enter a plate number to define a Target Plate.
If no time is selected, Stakeout will search All Time in the given area. Once an address is entered, a default geo-fence will appear on the map surrounding the desired location.
There are many mapping tools provided within the Stakeout application to help users define the exact perimeter. In the upper right corner, the geo-zoning tools consist of a Linking tool to allow users to Link to the exact location with identical geo-zone for future reference. The hand tool allows you to move the map to within the field of view. The radius tool will create a circle around the initial point clicked on and expand with radius denoted in miles. Before rezoning, you can need to zoom out using the [+] symbol in the upper left corner. As with other Google Map tools, you can also use the scroll wheel of the users mouse. The fourth option in the geo-zone tools would be the polygon tool, which allows you to draw three or more connected points to create a polygon perimeter. This can be useful to define an exact area when combined with satellite map mode. The fifth geo-zone tool allows the use of a rectangle type zone. This tool is useful in creating zones very quickly for city blocks. Lastly, the eraser tool allows you to clear the map and attempt a new zone.
If you desire to add multiple searches with different locations and time periods, you can select + next to the existing tabs. To create a new search, simply repeat the steps above and click Search when complete. A new zone and results will appear for each tab created. Multiple locations are required for Associate Analysis and Common Plate Reporting.
Mapping Alert Service
Mapping Alert Service (MAS) allows the graphical representation of hits against Site Hot Lists generated from both Site-generated LPR data, LPR data shared from other agencies, and data originating from Vigilant.This is presented through icons within a Map layout with the option to filter by time, Hot List, and type of hit. Before using MAS, the manager needs to assign Alerts and Hot Lists to each user, and assign icon for each alert using the Icons feature.
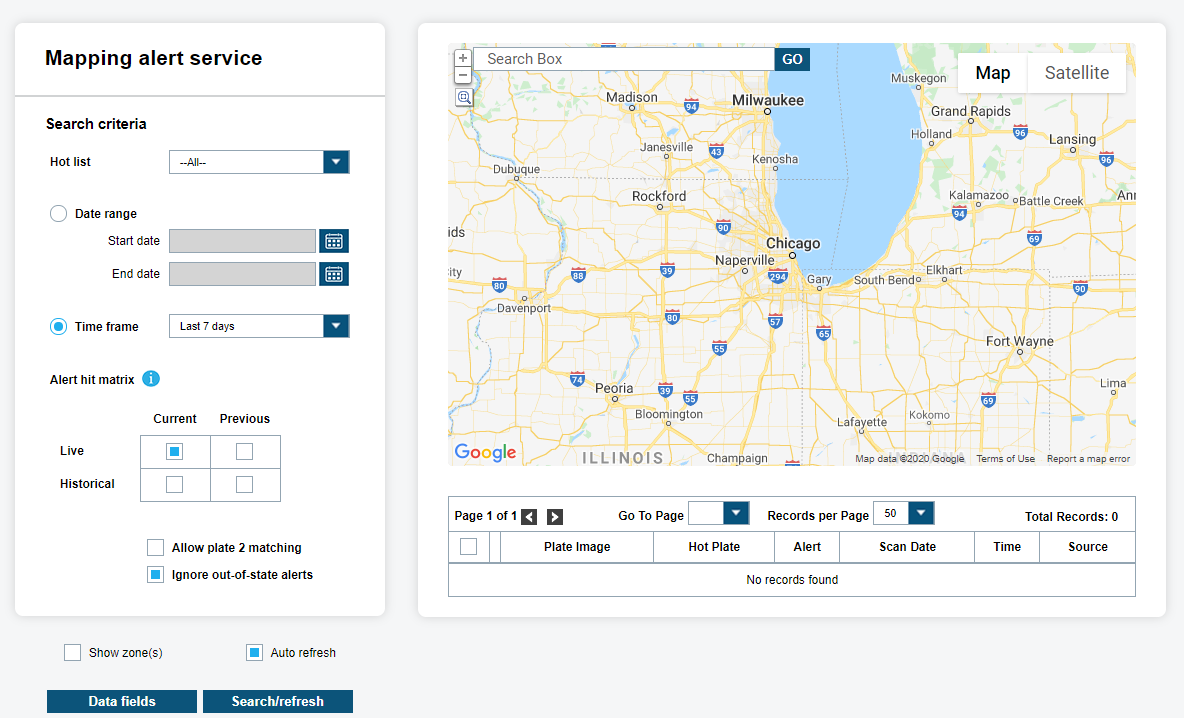
Search Criteria
You can filter the hits by a specific Hot List using the Hot List drop down. Once a user is selected, you can filter by Date Range or Time Frame. Some users are limited to the time frame allowed to them. Map searches will show the users effective time frame that is available.
With the Alert hit Matrix, you can view Live vs. Historical hits or Current vs. Previous hits. A Live hit is generated when a Hot List record already inserted into the database and a detection is made after uploading the Hot List.
A Historical hit is generated when a detection record already inserted into its database and a Hot List upload is made after the detection. Live hits are generated in Vigilant CarDetector, where Historical hits are only generated in the system.
A Current hit is generated when the Hot List is Active. Instead of deleting Hot Lists, the system has the ability to make them active or inactive. Upon making them inactive, the Hot Lists will continue to create hits in background but not alert users. A Previous hit is generated when the Hot List has become Inactive and therefore the hit becomes inactive.
You are also able to filter further by defining whether to search using Plate 1 matching hits or Plate 1 & Plate 2 matching hits. When the Vigilant CarDetector software scans a plate, it uses an Optical character recognition (OCR) Engine to identify the characters. The system can attempt two OCR reads per capture. The secondary read is considered Plate 2 and can sometimes be helpful when searching for harder to find plates. Lastly, The system has the option to select Hot List State MUST = Detection State, which filters out Out-of-State alerts when selected. This can be useful when there can be an abundance of Out-of-State Hot Lists, and you wish to only view alerts that apply to where vehicle was scanned.
Adjusting Search
When searching, you can turn on and off the geo-zoned map for the Private Data or Local Data using the Show Zone(s) feature.
If applicable, it will show the user zone, site zone, and Private Data zone. Where the maps overlap, will be the viewable hits for the selected user. As an added feature, the system has included an Auto-Refresh feature that will automatically update the hits as you navigate the map using the Google Navigational tools.
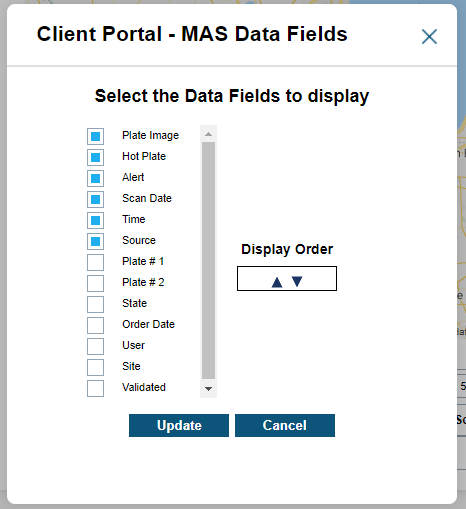
There is also the Data Fields option to customize the table output of the viewable hits. The defaults below can be added or subtracted based on desired output. To change the Display Order, simply highlight desired field and use arrows to move up and down. Fields will be display in order, left-to-right.
After all desired MAS settings have been configured, you will need to select Search/Refresh to initialize the Alerts on the map. You should see something like the results below if using a map. The hits will display for each configured Alert.
The filmstrip tool allows for quick Color Overview of the vehicle. The detail in the filmstrip will only include the Hot Plate, Scan Date, and Alert name.
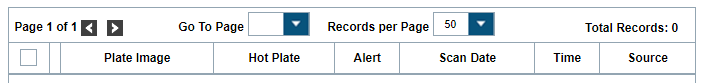
The Table data returned after running query will show the default columns (Plate Image, Hot Plate, Alert, Scan Date, Time, and Source). At the top of the table, there are function buttons to navigate through multiple records using the left-right arrows. Further, there is the option for a drop-down option to jump to a specific pate. You will also have the option to increase the number of records per page up to 500. This option also dictates the maximum icons per map that is viewable at any given time. Thus, if you wish to map up to 500 icons at the same time, you will want to select this option.
If you would like further data on an individual scan, you can select the Info link next to each record. You will be presented with a pop-up Vehicle hit Report. To output a PDF printable version of the Vehicle hit Report, you will need to select a check box next to the desired record and click Output Report.
Generating Report
Within the Vehicle hit Report, you will see the Nearest Address and Nearest Intersection with Satellite and General map overview. Within the Map views, you will see a pin for exact location and a red circle indicating possible GPS deviation. On the right side, you will be presented with both Infrared and Color overviews. Below this, you will see Detection Data that encompasses Vehicle Info and Camera Info. Further down the report, you will notice Hot List Data associated with the hit. This will include Alarm and Record Detail information and any notes associated with the record.
Mapping Alert Service also includes the option to create an LPR system hit Report in PDF format. By clicking on Output Report and not selecting any records, the hit Report is generated. The LPR system hit Report is an overview of what was generated during MAS query. The LPR system hit Information will display Start/End Dates, Time Frame, Hot List, Unique hits, Total hits, and User information. The LPR system hit Map should be an identical representation of the queried Map in MAS for the selected user view.
Density Map
When selecting Mapping Alert Service, you also have the option to view as a Scan Density Map. You can select the drop-down box within the MAS utility, or select the MAS tab and then Density Map. This is useful to evaluate the coverage of your LPR system patrol, and address target-rich areas that require additional patrol.
Adjusting Search Criteria
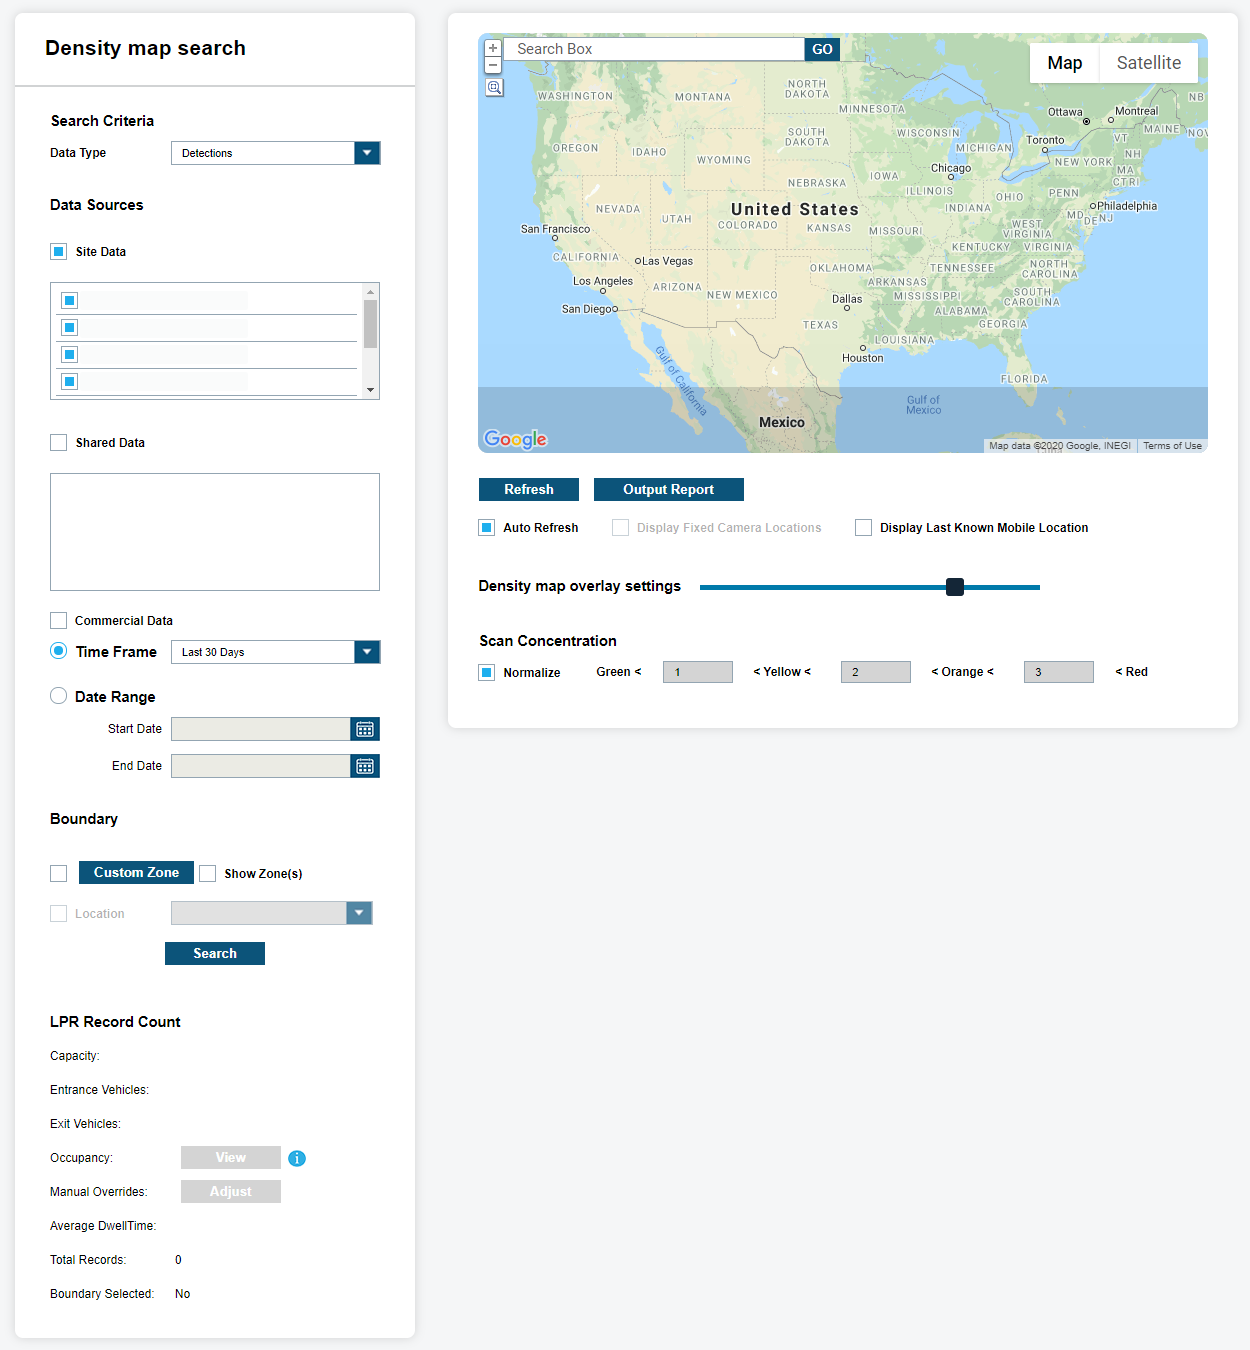
When performing Density Map searches at the manager level, you will be prompted to select a Data Type of hits or Detections from the drop-down box. The Data Source allows the manager to view the Density Map utility through the view of the Site/Agency Data, Private Data, Shared Data, or All data. Some Agencies can have want to limit views of hits or Detections as it pertains to individual users. Select Site/Agency Data source and then select the user in the Contributor drop-down box. This will cause difference to their Mapping of those hits and detections between various users. Once a data-pool is selected, you can filter by Date Range or Time Frame.
Adjusting Search
When searching by clicking Refresh, you are also capable of turning on and off the geo-zoned map for the Private Data or Local Data using the Show Zone feature. If applicable, it will show the User zone, Site/Agency zone, and Private Data zone. Where the maps overlap, there will be the viewable hits for the selected Contributor. As an added feature, an Auto-Refresh feature is included so that you will be able to automatically update the hits and events as you navigate the map using the Google Navigational tools. Within the Vigilant CarDetector Record Count section will display Total Records and whether a zone is selected.
The LPR Record Count section will display the number of total records and whether a zone is selected along with various statistics about the selected zone. Here, occupancy counts can be viewed and adjusted as well. Click the View button to be redirected to the Plate Query interface with the View Active Hits option pre-selected and the Date/Time selection from the Density Map is preselected.
You are capable of using the dynamic Geo-Zone just for the Density Map session. Simply select Zone and you will be presented with the Geo-Zone tool described in Assign user Geo-Zone section of this Guide.
Once you refresh from setting dynamic Geo-zones and the desired data, you will be presented with a Density Map of hits or Detections. By default, you will be presented with a Normalized view of the Density Map. The colors of Green, Yellow, Orange, and Red dots will appear based on the ma vase dib the density of the scans in the area. More scans would be Red while fewer scans would be Green. You can turn on and off the Geo-Zoned areas with the Show Zones box.
There is also the ability to increase and decrease image overly transparency using the Transparency Scale. You can also change the Scan Concentration from Normalized to user-defined. Thus, you can make up your own density requirements.
For example, you can alter the top number to be an exact number of 1000 scans. Anything greater than 1000 will be Red and anything less will be Orange, Yellow, or Green. If the number of scans falls within the user-defined scale, it will display with the color associated with it.
Generating Report
When clicking the Output Report button, you will be prompted to save the report to a location on your machine in PDF format. Within the Report, it will show the Site/Agency, Data Source, Time Frame, Data Type, Contributor, and Total Records. It will display the Density Map Overlay in a normalized scan concentration view.