Locate Analysis
Locate Analysis is a tool that allows the Law Enforcement the ability to search a single plate across multiple locations. To use the feature, go to .
Locate Analysis will use algorithms to determine the commonality of the plates and group them together by location. The tool will score the locations with confidence algorithms based on how often the plate is detected at a location and other factors. With this confidence score, you can decide on what locations need further investigation.
Search Criteria
When we attempt a Locate Analysis search, we will be presented with a box to enter a plate and a Locate Analysis Search button.
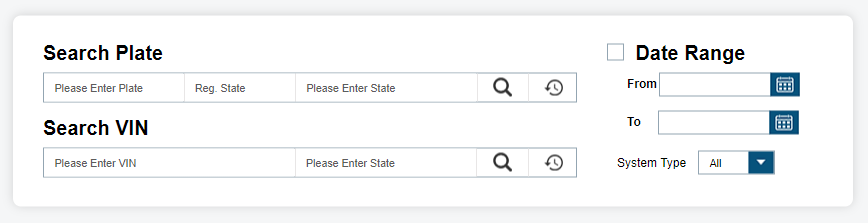
To search for a plate, enter the following details:
- Plate
- Registration State: Registration State will return VIN data if available.
- State: Filter by up to five states or leave blank for all states. Results will only show scans on the selected states.
To search for VIN, enter the following details:
- VIN
- State: Filter by up to five states or leave blank for all states. Results will only show scans on the selected states.
Click on the Search button to bring up the saved searches
During search process, you will notice the locations being loaded in the upper-left corner of the page, Loading X/X Locations. The number of locations per page is ten and can be changed by selecting the drop-down box. If the number of locations exceeds the per page value, the exceeded locations will be displayed on the following pages. You can navigate to exact page or use page arrows to navigate to new page.
Search Results
Once your query request has completed, you will be presented a list of locations and the detections that are grouped with them. The sets of locations are displayed as the following:
- Best Public Record Address
- DMV Address
- Most Recent Sighting
- Most Popular Sighting Location
- Second Most Popular Sighting
If available through public records, you will see the Address. Otherwise, these two addresses can be entered by you in the box displayed with UNAVAILABLE via public records. If detections are found at or near the location, they will be displayed under the updated location. If more than two locations are required, you can add a location of a known point of interest using the Add Location button.
The Most Recent Sighting location will consist of the location where the vehicle was last detected. The Most Popular Sighting Location will consist of the greatest number of sightings of the vehicle. The Second Most Popular Sighting Location will consist of the second greatest number of sightings of the vehicle. If you desire, you can change the names of the locations to a more meaningful name. For example, you can alter Most Recent Sighting to Suspects Rendezvous Location.
Each location will group the detections based on the probability they are close enough in proximity to be considered grouped. You will be displayed an Address that is the central point of the grouped clustering. Also, a map overview of the address will be available. From the map overview, you can determine the proximity to other addresses. If multiple locations are close enough in proximity to be considered a single location, you can select check boxes next to each location and Merge Locations button. Once merged, the analytics will be recomputed and you will see the detections combined. If the detections are too far apart, Locate Analysis will prevent merging.
For each record, it will display whether the Location Type is Residential, Workplace, Commercial or Mixed-Residential. It will display the number of times the vehicle was sighted and the total number of visits to the location. A visit is considered when the LPR vehicle, not the target vehicle, visits the location. From this, we can give a percentage of the number of times the vehicle was seen during the LPR vehicle visits as % Seen per Visit. Based on this percentage, we determine the Vehicle Popularity at Location. We also determine when the vehicle was first seen and last seen at the location. This helps to determine if vehicle has been recently seen, and the period between the first and last visit. From all of this data, we are able to determine a Locator Score. This will highlight the confidence score of seeing the target vehicle at that location. Lastly, we include whether the vehicle was most commonly seen at Night, Day, or Varied.
The Map it feature allows for an overview of the vehicle so that all of the detections can be displayed in a single map overview with a series of map pins. The detections can be navigated using the bottom date navigational bar by using the left and right arrows. Also, by clicking on a single pin on the map, you will be transported to that point in time on the date navigational bar. We are then able to see the vehicle detections that occurred right before and after the target time. The pins also coordinate colors of the Locator Score to help visualize the probability of finding vehicles at that location.
- Red=Low Probability
- Yellow=Medium Probability
- Green=High Probability
Reports
When you select Create Map Report from Map View, you will be presented with the Geo-Spatial and Temporal Analysis Report. This report will display the map overview of all detections and order them in date-time descending order with newest on top. Next to each Detection, an address will be listed with a Locator Score. This map is used to help identify larger patterns as it relates to locations. This can help consolidate locations as well as eliminate locations. For more information, use the Scoring Legend at the bottom of the report to help explain the report statistics.
When you select Output Report on the Locate Analysis page, you will be given the following options:
- Locate Analysis Report (All Locations)
- Locate Analysis Report (Selected Locations)
- Multi Report - PDF
- Multi Report - XLS
- Multi Report - XLS (No Images)
The most common report is Locate Analysis Report (All Locations). It will provide a report of each location ordered by the locator score descending.